skip to main | skip to sidebar

Monday, December 8, 2008

Isoline map


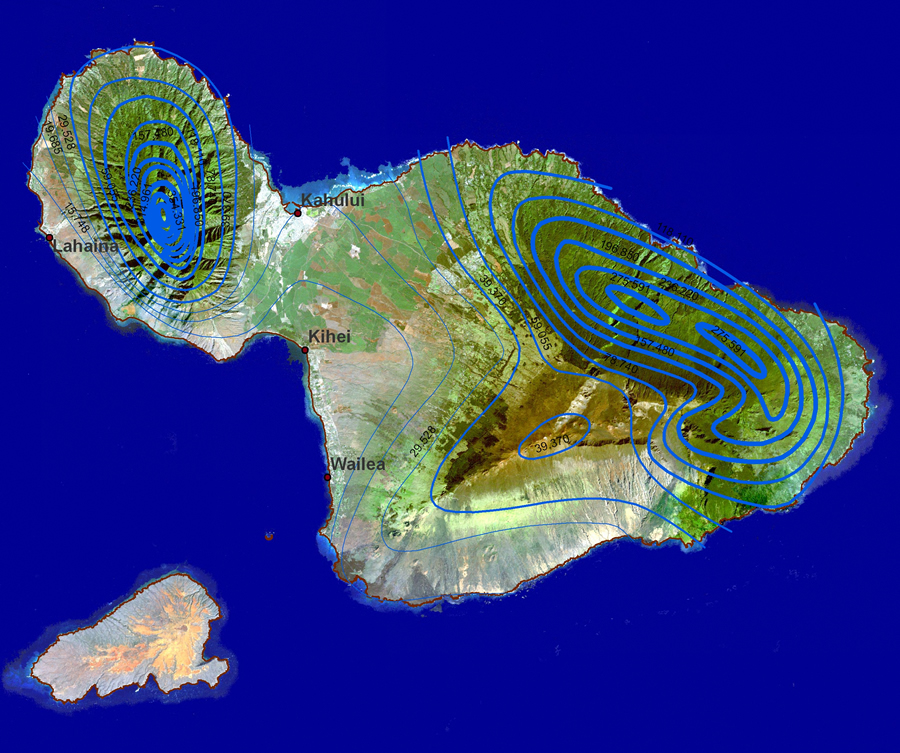
This map of Hawaii is an example of an isoline map. An isoline map has cuving lines which represent areas of similar contours and reliefs. The isolines in this picture of Maui, Hawaii demonstrate the amounts of rainfall in an area. The connecting isolines recieve approximately the same amount of rain, and each different isoline depicts an entirely different quanitity.
Posted by maybay421 at 8:35 PM

No comments:

Post a Comment

Newer Post Older Post Home
Subscribe to: Post Comments (Atom)

Southern Hospitality

Blog Archive

  • ▼  2008 (49)
    • ▼  December (47)
      • Stem and Leaf plot
      • Boxplot
      • Histogram
      • Parallel coordinate graph
      • Triangular Plot
      • Windrose
      • Climograph
      • Population Profile
      • Scatterplot
      • Index Value Plot
      • Lorenz Curve
      • Bilateral Graph
      • Nominal area choropleth map
      • No title
      • Unstandardized choropleth map
      • Standardized Choropleth Map
      • Univariate Choropleth Map
      • Bivariate Choropleth Map
      • Unclassed Choropleth map
      • Classed Chroropleth Map
      • Range Graded Proportional Circle Map
      • Continuously Variable Proportional Circle Map
      • DOQQ
      • DEM
      • DLG
      • DRG
      • Isopleth Map
      • Isopach map
      • Isohyet
      • Isotach
      • Isobars
      • LIDAR
      • Doppler Radar Image
      • Black and White Aerial Photo
      • Infrared Aerial Photo
      • Cartogram
      • Flow map
      • Isoline map
      • Proportional Circle Map
      • Choropleth map
      • Dot Distribution Map
      • Propaganda map
      • Hypsometric Map
      • PLSS map
      • Cadastral Map
      • Planimetric Map
      • Mental Map
    • ►  September (2)

About Me

maybay421
View my complete profile